
New "Moving Average" on moving averages
The Moving Average indicator is a classic tool for Forex trading; it gained its popularity quite a long time ago, and not without reason.
Quite a few improved scripts have been created based on the standard version of this tool, one of which is presented in this article.
The script is based on the same principles; just like the basic version, it works on the basis of moving averages, although now there are four of them.
And unlike the usual version of the script, the data display is now displayed in a separate window.
This allows you to give a detailed picture of the price movement on the time period of your choice; now you have the opportunity to simultaneously assess the situation on several time frames at once.
Useful Spread size indicator for MT4
A fairly necessary thing for every trader, such as the spread indicator, will allow you to constantly monitor the size of the broker’s commission for any currency pair.
Now there is no need to constantly peer at quotes; all the information you need is right in the window of the trading terminal.
Spread - the amount of the broker's commission that he takes from each transaction for the purchase or sale of currency, can be either fixed or floating, which changes depending on the volatility of the market or at the request of your broker.
The lowest indicator is observed for currency pairs involving the US dollar, and the highest for exotic trading instruments on Forex.
The spread indicator is simply necessary for those who trade using the scalping strategy or use pips to make money on Forex.
Forex news indicator for mt4
Trading on news is one of the most popular strategies on the Forex currency market and the stock exchange; it allows even a novice trader to make a profit without any special knowledge.

This strategy is based on monitoring the release of major financial news and, based on the information received, decisions are made on opening new transactions, their direction and duration.
The news indicator for MT4 makes it possible to receive information in the fastest and at the same time convenient way.
Thanks to it, news is displayed directly in the mt4 trading terminal, which gives some advantage over other traders and greatly simplifies the work.
At the same time, we should not forget that not every news is reflected in the movement of the trend, some events are practically ignored by the Forex market, so you should not rush to open a transaction, but you must first wait for the price to react to the release of the news.
RSI index indicator
Another tool for finding the most successful entry points into the market, the RSI index indicator allows you to quickly and, most importantly, quite accurately analyze the prevailing trend in the Forex market.
The script works equally effectively on all currency pairs and any time frames, and is completely universal.
With its help, you can trade using almost any trading strategy, and the available settings allow you to adjust the script according to your needs.
The RSI index is also called the relative strength index; an indicator developed on its basis makes it possible to determine the occurrence of changes in the main trend of the price movement of a currency pair.
The basis of the work is the divergence of two moving averages, and the main signals are their intersection of the established price levels.
Dollar Index Indicator (USDX)
Simply an irreplaceable indicator for those who like to establish a connection between the dollar exchange rate and the fundamental factors influencing it.
The indicator is designed to integrate an indicator such as the dollar index (USDX) into the chart of a currency pair; it not only shows the latest value, but also displays the dynamics of change over a certain period of time.
And this makes it possible to track the impact of changes that have occurred on the exchange rate of the US dollar.
The dollar index indicator is practically a ready-made tool for trading with building a relationship (correlation) between the exchange rate of the American currency and the USDX index; it can be used on any of the currency pairs that include the US dollar.
The dollar index displays US trade turnover with a number of leading world powers; it contains the proportion between imports and exports of goods, and also takes into account a lot of other equally important parameters in the calculations.
Fractals indicator, setup and use
Fractals occupy one of the leading roles in the technical analysis of the Forex market; their construction is a rather labor-intensive process and requires a lot of time.
The fractals indicator is designed to solve this problem automatically; it will take on all the mechanical work.
This will free up time for additional analysis of the situation on the Forex market and the development of new profitable trading strategies.
The program is fully functional and is as easy as possible to install and configure.
Fractals themselves represent one of the varieties of minimum and maximum points that allow you to create a picture of the market.
New ATR indicator
The well-known ATR indicator has undergone significant changes. Now, for greater clarity, it is combined with the MACD indicator.
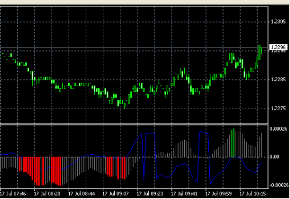
As a result of connecting the scripts, all standard functions were preserved and new features were added; the new program became even more functional and efficient.
In fact, a new technical tool has appeared that combines the useful properties of long-known Forex scripts.
Now, after installation on the trading platform, you can observe not only the usual curve, but also a multi-colored MACD histogram.
This approach makes it possible to conduct a comprehensive trend analysis and timely identify all possible trends in the Forex market.
Also, now you will not need to place two indicators of the same name on the chart.
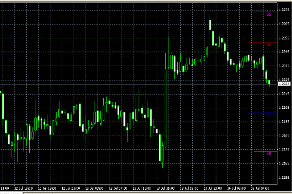
macd indicator, description and settings
The macd indicator, proven by time and by many professional traders, allows you to trade Forex quite effectively.
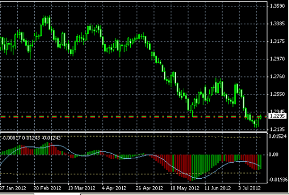
Its new version has become even more accurate and functional; it analyzes the trend based on the current situation taking into account historical data, which makes its use even more justified and effective.
The visual display of the received data has been improved, new operating parameters have been added.
Now, to improve the work, two new levels are displayed in the indicator window; they allow you to avoid false signals, you open transactions only at the most favorable moments.
A moving average was also added, thanks to which the movement of the main trend in Forex is quite accurately conveyed. It is displayed as a blue curved line.
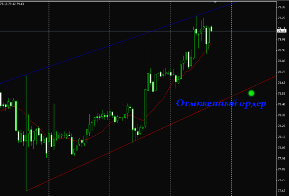
Automatic construction of Linear Regression
A simple and at the same time quite effective Linear Regression indicator allows you to automatically build a linear regression channel.
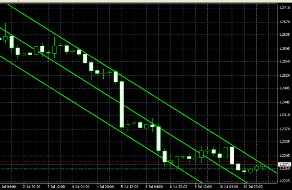
It independently finds the necessary levels, you just have to decide to open an order that determines the boundaries of the channel.
When testing problems in the operation and installation of this script, no problems were found; the program is completely ready for use and can even work with default settings.
The construction is carried out based on the specified parameters; at your discretion, you independently set the channel width and time frames.
The program perfectly determines all significant minimum and maximum points in the time period you select.
Fibo levels (channels) indicator
Trading based on Fibo levels is one of the most common Forex trading strategies; the levels form price channels that serve as the basis for analyzing and forecasting the situation on the Forex market.
Building them manually is quite labor-intensive, so a more rational approach would be to use a technical indicator that will independently perform all the routine work.
All you have to do is analyze the current situation and choose the most suitable trading strategy.
This can be either trading inside a channel or trading on a breakout, and a larger number of lines significantly expands the possibilities of analyzing the market situation.
The indicator is installed in standard mode.
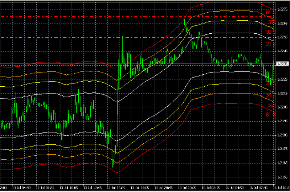
Automatic construction of support and resistance
This script is designed to build support and resistance lines; after entering the appropriate settings, it builds several levels on the chart of a currency pair.
Which allow you to quite accurately determine the minimum and maximum price values depending on the time interval.
The constructed lines are more reminiscent of price levels than support and resistance lines, so working with them has some distinctive features.
Here you will not see the classic price channel, but only levels for different time frames.
This is more of an analytical tool than a means of searching for entry signals, since the script does not give clear signals and does not highlight entry points.
Trend line indicator
Trend lines are the basis of most strategies used in financial markets; if desired, they can be built manually using the capabilities of the trader’s terminal, but a simpler solution is to use the “Trend Line” indicator.
This tool will quickly draw support and resistance lines on the chart of a currency pair based on a given time period.
This will allow you to implement a trading strategy in a price channel without wasting time on manually drawing channel boundaries.
Another advantage is that the trend line indicator automatically rebuilds the lines simultaneously with the movement of the currency pair chart, which is not possible with manual construction.
Your task is only to install the indicator and enter the initial data or use the default settings.
Forex channels indicator, automatic construction of price channels
A fairly advanced indicator that allows you to simultaneously display several channels on the chart of a currency pair, each of which corresponds to its own time frame.
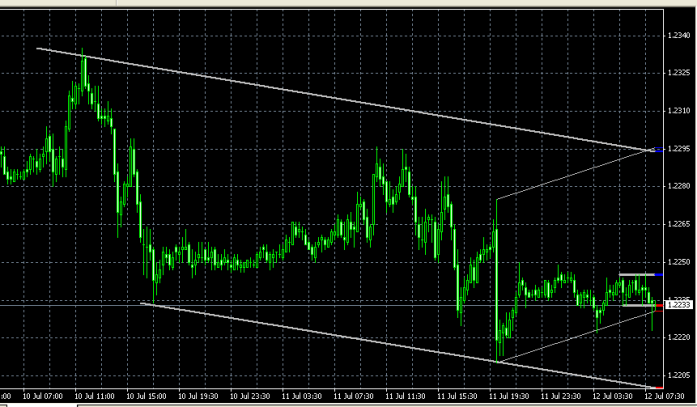
This approach makes it possible to easily analyze the dynamics of the trend in the long and short term.
Automatically building channels using the channels forex indicator will save you a lot of time and achieve more impressive results in trading.
The tool is distinguished by correct operation and easy setup; for it to work, you will only need to enter data for three time periods.
The best trend indicator "Ultra wizard".
One of the best options for the trend indicator, Ultra wizard, allows you to fully assess the state of the trend, displays data on the probability of a reversal, and also provides a lot of additional information. It can truly be called the best trend indicator, since the information it provides gives a complete picture of the current trend in the Forex market.
rainbow indicator
One of the most beautiful indicators designed for trend analysis, based on many popular scripts, which, thanks to an integrated approach to trend analysis, give a fairly accurate forecast of price movements.
In addition to its interesting appearance, it should be noted that this tool is also one of the most effective trend indicators.
The developers position the rainbow indicator as a professional tool for technical analysis of trend movements; it is highly functional and has a lot of additional settings.
This is a rather complex program for the Metatrader 4 trading platform and other versions of terminals based on it.
Super trend forex
An exclusively trend indicator, it allows you to display on the chart the current and historical direction of the trend in the form of graphic lines that change their color depending on the fall or rise in the price of the currency pair.
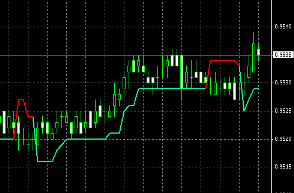
It is of dubious usefulness; its main purpose is to analyze trend movements over a selected time period.
At first glance, it is not entirely clear why this tool is needed; it seems that it simply repeats the price movement and creates a beautiful picture.
The price direction changes depending on the time frame change, so this indicator can be used as an auxiliary tool when trading trend strategies.
The advantage of super trend is its simplicity; it clearly identifies reversal points on the chart of a currency pair, which makes it possible to analyze the reasons for the trend change.
Fourier Extrapolator (Fourier extrapolator) indicator for the stock exchange
Fourier Extrapolator is an interpolation method that uses the Fourier transform to estimate function values at points that were not directly measured.
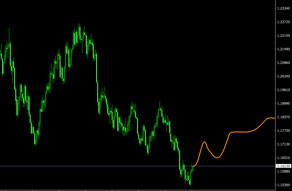
The method works by expanding a function into a Fourier series and then using that series to estimate the values of the function at points of interest.
This method was used to create the indicator of the same name.
This script tries to predict the further price movement in the next few minutes; it not only determines the current direction of the rate movement, but also independently makes a forecast, thanks to which you can choose the direction of opening an order.
Fourier Extrapolator is another attempt by developers to create a script that guesses a trend; how successful it is can only be verified in practice.
Forex trend indicator
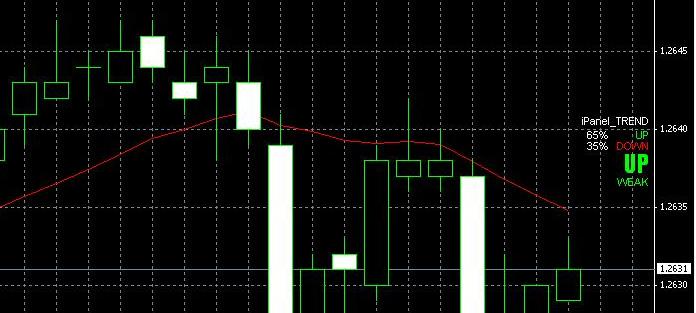 A proven indicator for determining the direction of price movement, it practically does not require additional settings and copes well with its main task.
Suitable for trading almost any Forex strategy.
Shows the probability of the trend direction as a percentage, and also evaluates the strength of the existing trend.
This tool works using proven algorithms with fairly high accuracy, which makes it possible to guess the direction of the trend by more than 75%.